Trend Signals
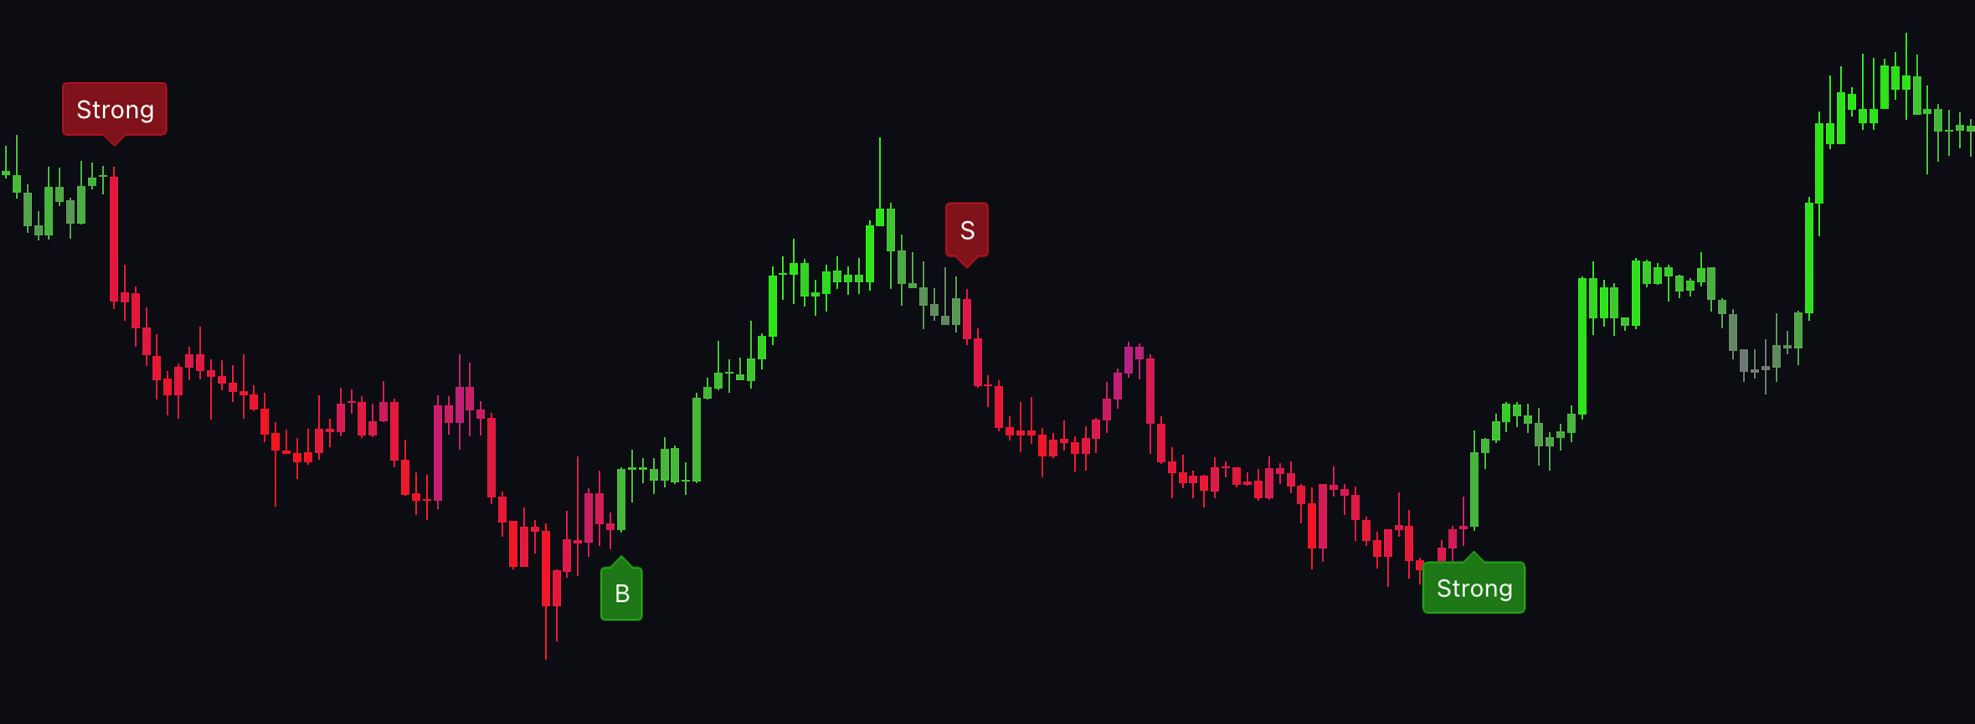
Our trend (or trendy) signals are one of the most iconic features of ChartPrime. These adaptable and low-lag signals analyze market trends and provide simple buy, sell, or strong indications on candles.
A buy signal indicates that the market is in an uptrend.
A sell signal indicates that the market is in a downtrend.
A strong signal indicates that the market is strongly trending, appearing red if the trend is downward and green if it’s upward.
 |
|---|
| Trend Signals in action |
These signals should not be used blindly and are only an indication of a trend change. We strongly recommend using these signals in conjunction with other forms of technical analysis to create a more comprehensive view of the market.
In addition to trend signals, take profit checks are provided. If the market is becoming overbought or oversold, a check will appear, suggesting a good opportunity to take profit on a position.
Optimization:
There are two main approaches to optimizing your signals:
1) Users can adjust and optimize via the tuning input in the settings. In the bottom right of the screen, you will find an "Optimal Tuning" dashboard that provides backtested settings yielding the best results over the asset's history. This is subject to change. The advantages lie in using a fixed value to ensure a reliable and repeatable strategy. The disadvantages are that the algorithm may be less flexible and dynamic to market changes or movements.
2) Using the Auto Pilot can provide a more dynamic and versatile approach to optimization. By enabling this feature, our signal generation algorithm can dynamically adjust its tuning input to respond to ranging or trending markets. Users can adjust the frequency settings between low and high according to their preferences. If a user desires more frequent signals, they should select high frequency to favor more signals; conversely, a trader wanting fewer signals would select low frequency.
 |
|---|
| Optimization options |
Read more about optimization here: Optimization in detail.
Choosing an optimization method is personal, and each method can benefit different traders in various ways. We encourage traders to test both approaches to see which they prefer before committing to an optimization technique.
Optimizing can introduce overfitting into a system, especially when manually entering backtested settings. Be cautious of bias!
Take Profits
Take profit labels in the form of ticks are provided. These offer real-time suggestions from our algorithm on when it might be a good time to take profit. A purple tick indicates the average take profit zone, representing a safer area. The red tick signifies above-average take profit potential, which could be an excellent opportunity to take profits. Finally, the MP label represents Maximum Profit, suggesting that trends may be about to reverse and this might be the last chance to achieve maximum profits.
There are many ways to take profit with ChartPrime. The provided take profit feature serves only as an assistant. For instance, traders could take profit when the price reaches a support/resistance zone.